
Key Takeaways
- Spot volume on leading crypto exchanges lowered by 2% in August despite market volatility
- Following The Merge update, market participants took an interest in Ethereum-based derivatives, boosting volume and increasing open interest.
- The futures market recorded one liquidation of more than $500 million when Bitcoin and Ethereum lost more than 10% of their prices.
- By the result of the month, Bitcoin and Ethereum prices went down by 14% and 5% correspondingly.
- Market capitalization as of September 8, 2022, lowered to $0.98 trillion, 13% less compared to the beginning of the month
- Bitcoin domination fell below 40% to the level of 2018 and the beginning of 2022.
Spot Market
Despite market volatility, trading volume on 10 leading exchanges in August 2022 decreased just by 2% versus the previous month and totaled $720 billion.
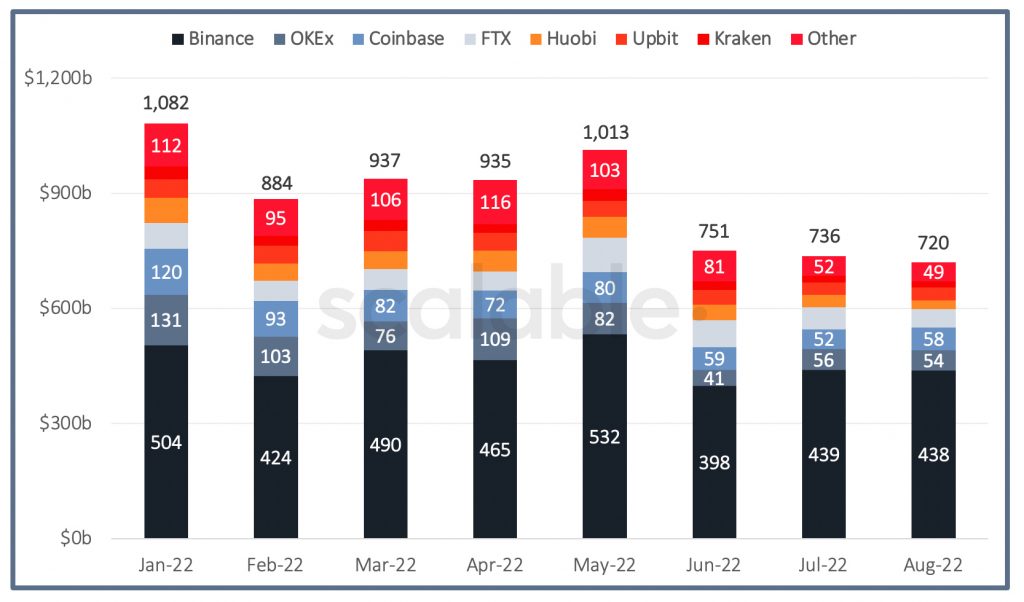
Graph 1. Cryptocurrency Exchange Volume [3]
Note: Other Category includes Kucoin and Gate.io
July Volumes were updated by the Block and changed insignificantly
Despite market volatility, trading volume on 10 leading exchanges in August 2022 decreased just by 2% versus the previous month and totaled $720 billion.
In August a volume drop was recorded among all the exchanges under consideration, except for Upbit ($33b, +2% MOM) and Coinbase ($58b, +13% MOM), which partnered with BlackRock at the beginning of the month.
Trading volume on Huobi ($22 billion, -29% MOM) slumped by the third in August after Huobi Group founder Leon Li announced selling a 60% stake in the crypto-exchange at a valuation of $3 billion.
The rest of the tier-1 spot crypto exchanges demonstrated a negative dynamic in trades versus the previous month:
- FTX: $49 billion (-14%)
- Kraken: $16 billion (-5%)
- OKEx: $54 billion (-4%)
- Binance: $438 billion (-0.3%)
As of 8 September 2022, the market share of spot cryptocurrency exchanges by trades is as follows:
- Binance (~61%)
- Coinbase (~8%)
- FTX and OKEx (~7%)
- Upbit (~5%)
- Huobi (~3%).
- Kraken (~2%).
- Other (~7%).
Futures Market: Volume & OI
1| Volume
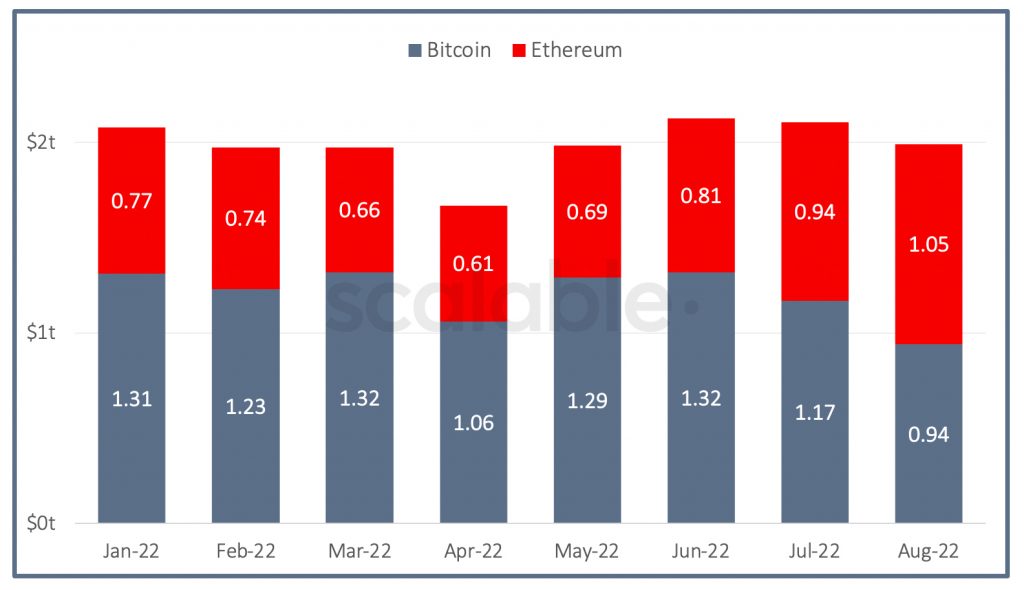
Graph 2. Volume of Bitcoin and Ethereum Futures [3]
- The total trading volume of bitcoin futures across leading cryptocurrency exchanges, in dollar terms, continued its downward trend since June 2022 and reduced by fifth in August to $0.94t. All cryptocurrency platforms offering Bitcoin futures demonstrated a volume shrink;
- As opposed to the first cryptocurrency, the volume of futures contracts of Ethereum showed progressive growth over the last 5 months with a 12% increase in August to $1.05t. It became the second largest result in the history of Ethereum-based derivatives. Users indeed have taken much interest in Ethereum-based futures most likely due to the upcoming transition to the Proof-of-Stake algorithm and the volatility of the asset;
- As of 8 September 2022, Ethereum and Bitcoin futures embrace 41% and 30% of daily futures trading correspondingly;
- Among other coins for futures trading, the most popular are Ethereum Classic, Solana, and Ripple.
2| Open Interest
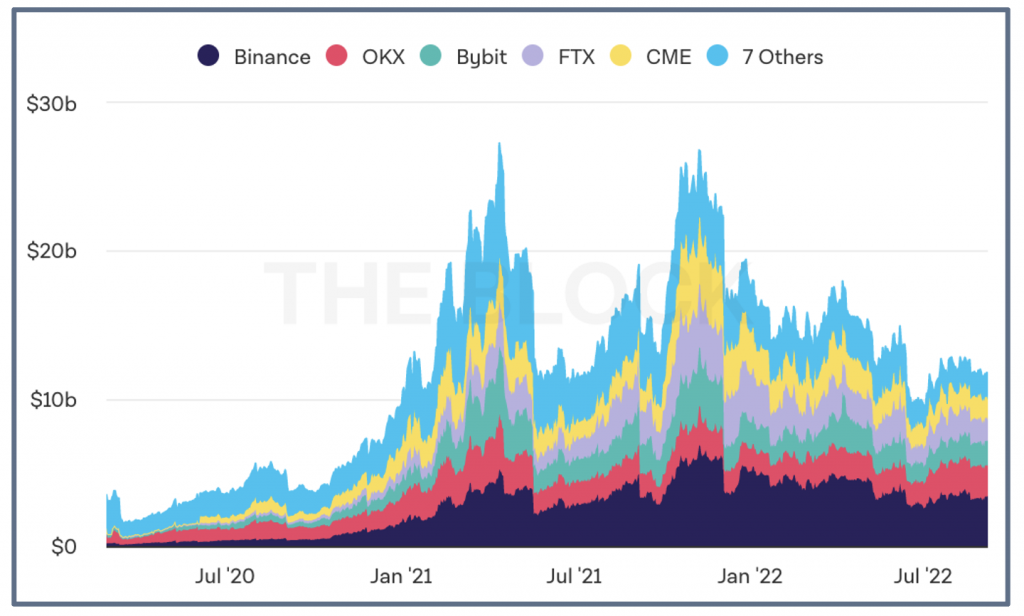
Graph 3. Aggregate OI of Bitcoin futures [3]
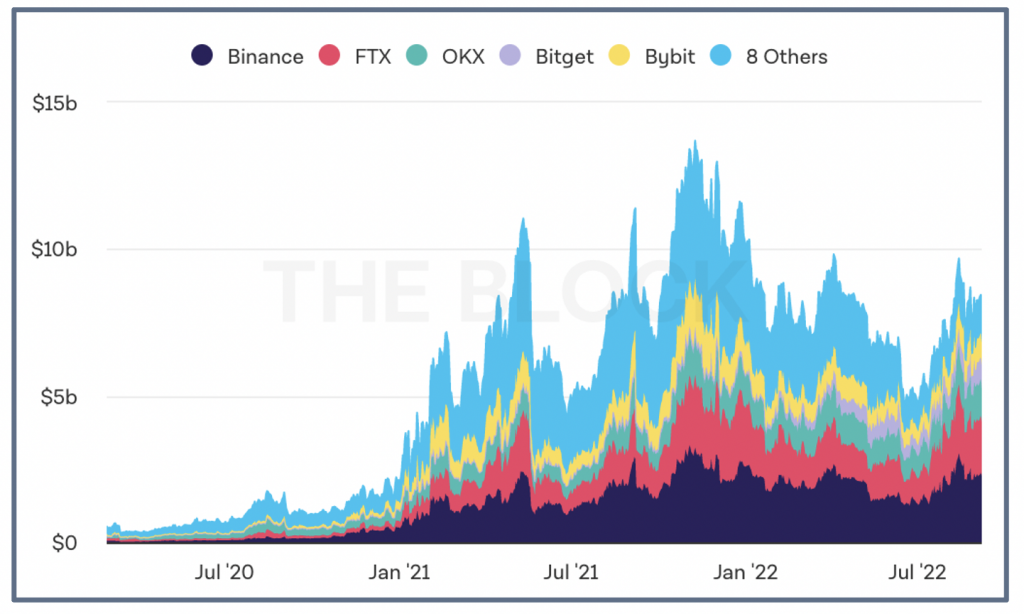
Graph 4. Aggregate OI of Ethereum futures [3]
- Since the beginning of August 2022, aggregated open interest (OI) of all crypto futures hasn’t changed significantly and as of 8 September achieved $23.6b. In particular, OI on bitcoin futures slumped by 10%, and on Ethereum, futures grew by 17%.
- As of 8 September 2022, dominance by open interest on the futures market is distributed as follows: BTC (41%), ETH (31%), and Others (28%).
3| Liquidation
During August, the largest liquidation on the futures market of more than $500M was recorded on 19 August ($641M), mainly on OKEx, Bitfinex, and Binance.
Nearly 60% of the total liquidation amount is accounted for the long position of Ethereum and Bitcoin when ETH and BTC lose 10% of their prices.
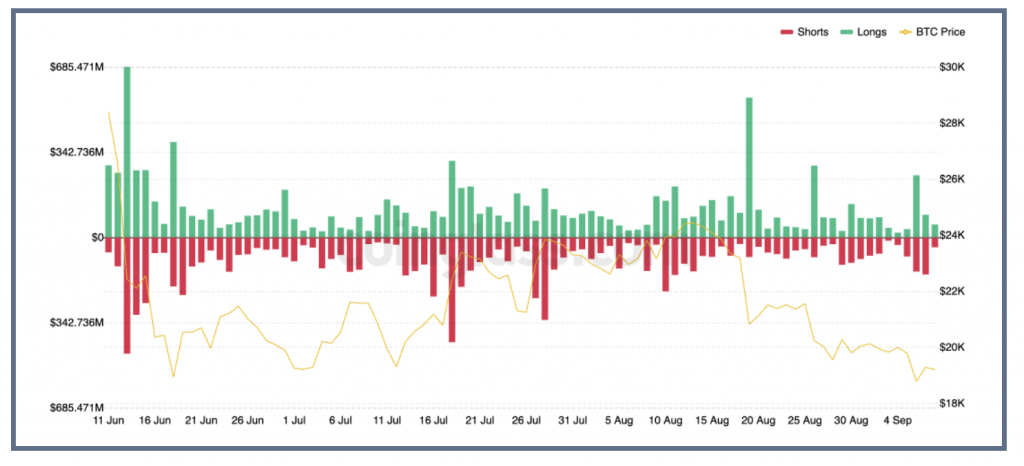
Graph 5. Liquidations [2]
Options Market: Volume & OI
1| Volume
- The movements of the options market were in line with the futures market. The options trading on Bitcoin in August continued to slow down and achieved $10.7t, while trades on Ethereum options speeded up by 7% to $12t.
- CME derivatives remain reliable metrics for gauging “institutional” interest in digital assets. Month-on-month, the CME volume of Bitcoin options recovered in August with a 43% increase to $558m.
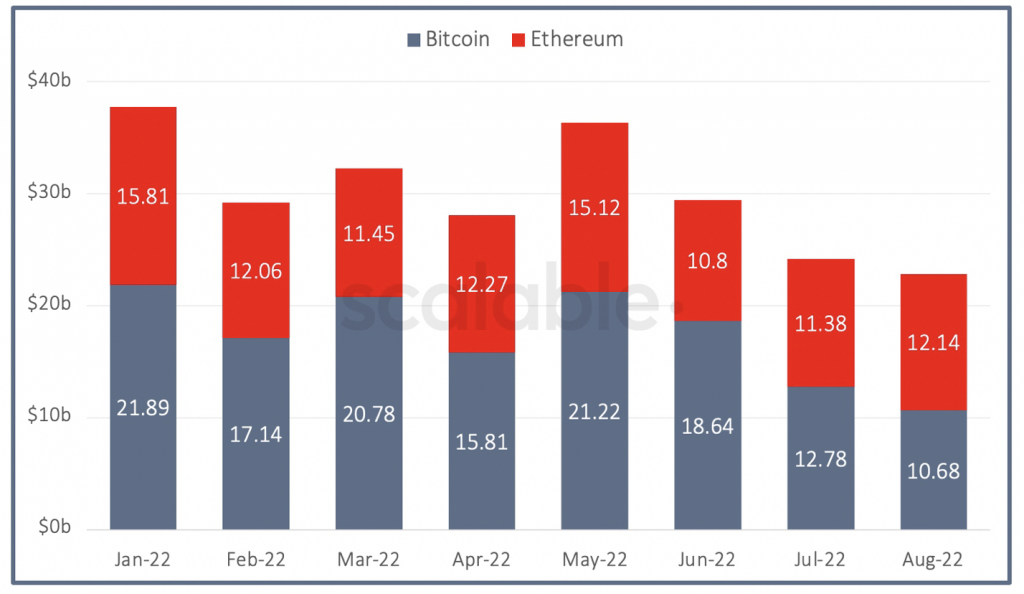
Graph 6. Volume of Bitcoin and Ethereum Options [3]
2| Open Interest
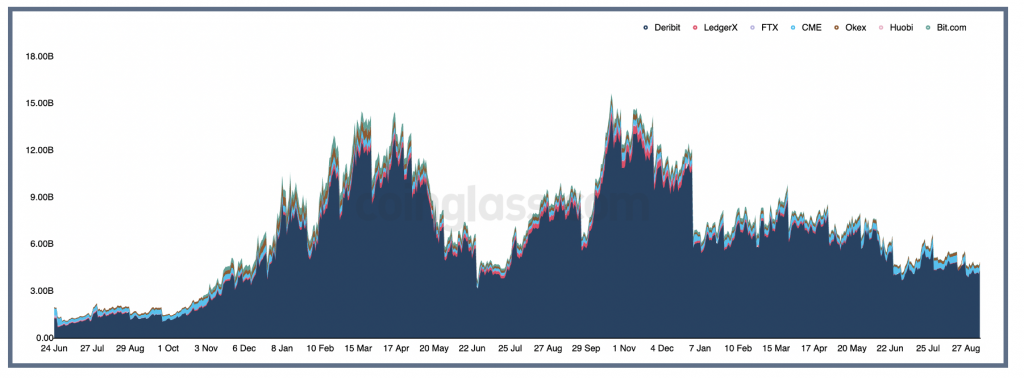
Graph 7. Aggregate OI of Bitcoin options [1]
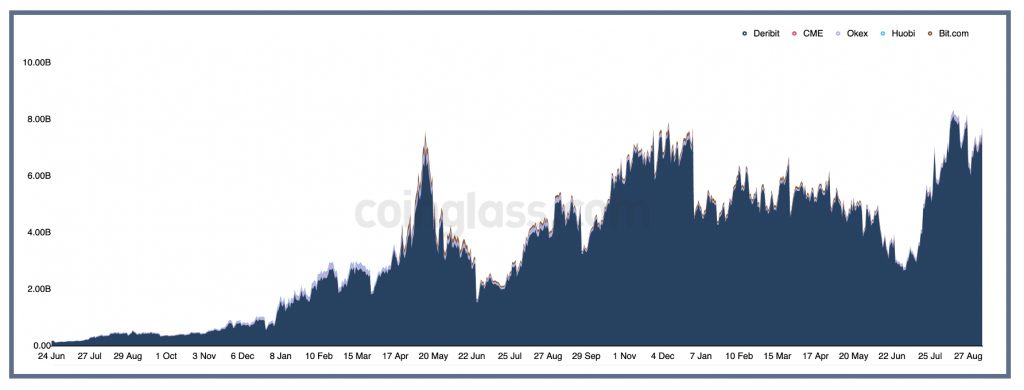
Graph 8. Aggregate OI of Ethereum options [1]
- From the beginning of August to 8 September 2022, aggregated open interest (OI) of options decreased to $4.90b for Bitcoin and increased by $7.73b for Ethereum.
Dynamics of Leading Assets
- In August, bitcoin expanded its price range to $19,500-$25,000. The month started from the local high update and then was followed by a correction.
- Ethereum demonstrated a better dynamic. Following The Merge update, the rate of the second largest cryptocurrency exceeded $2,000, but the month was closed at a level below $1,500.
- By the results of August, Bitcoin fell by 13.88%, and Ethereum by 4.90%.
- Bitcoin dominance fell below 40% to the level of 2018 and the beginning of 2022.
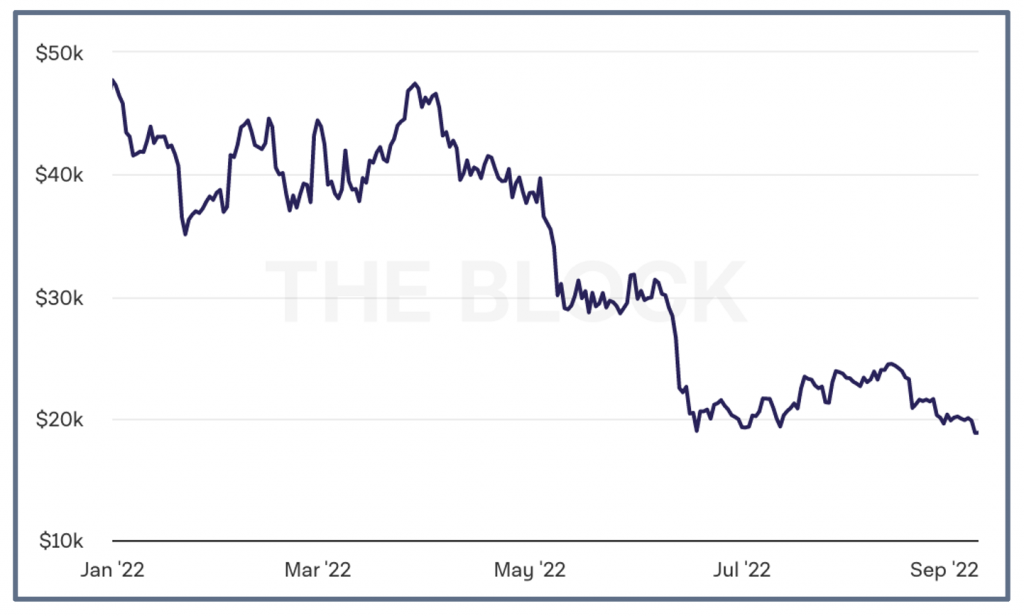
Graph 9. BTC price [3]
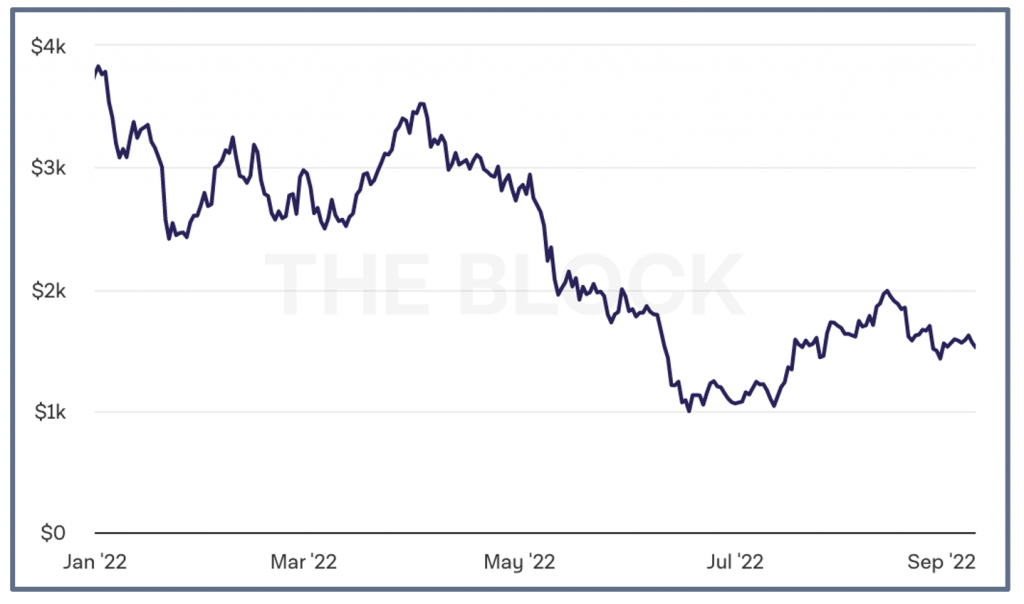
Graph 10. ETH price [3]
Market Capitalization
The total capitalization of the cryptocurrency market as of September 8, 2022, was $0.98 trillion, which is 13% less compared to the capitalization at the beginning of August.
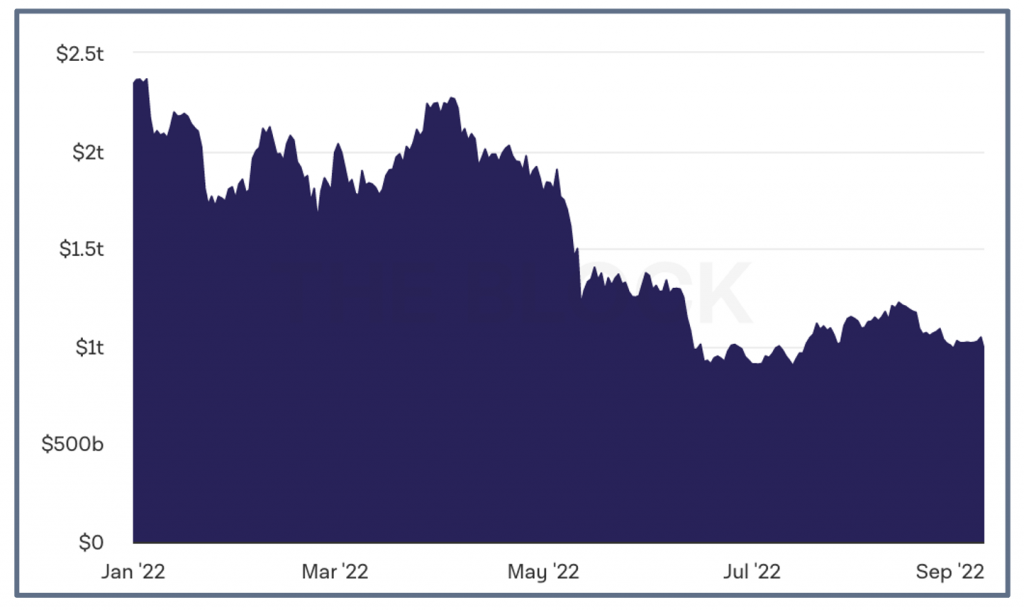
Graph 11. Total Market Capitalization [3]
References:
- Coinglass, 8 September 2022, URL: https://www.coinglass.com/pro
- “Futures Markets Global Charts”. Coinalyze, September 8, 2022. URL: https://ru.coinalyze.net/futures-data/global-charts/
- The Block Crypto, 8 September, 2022, URL: https://www.theblockcrypto.com/data/crypto-markets/