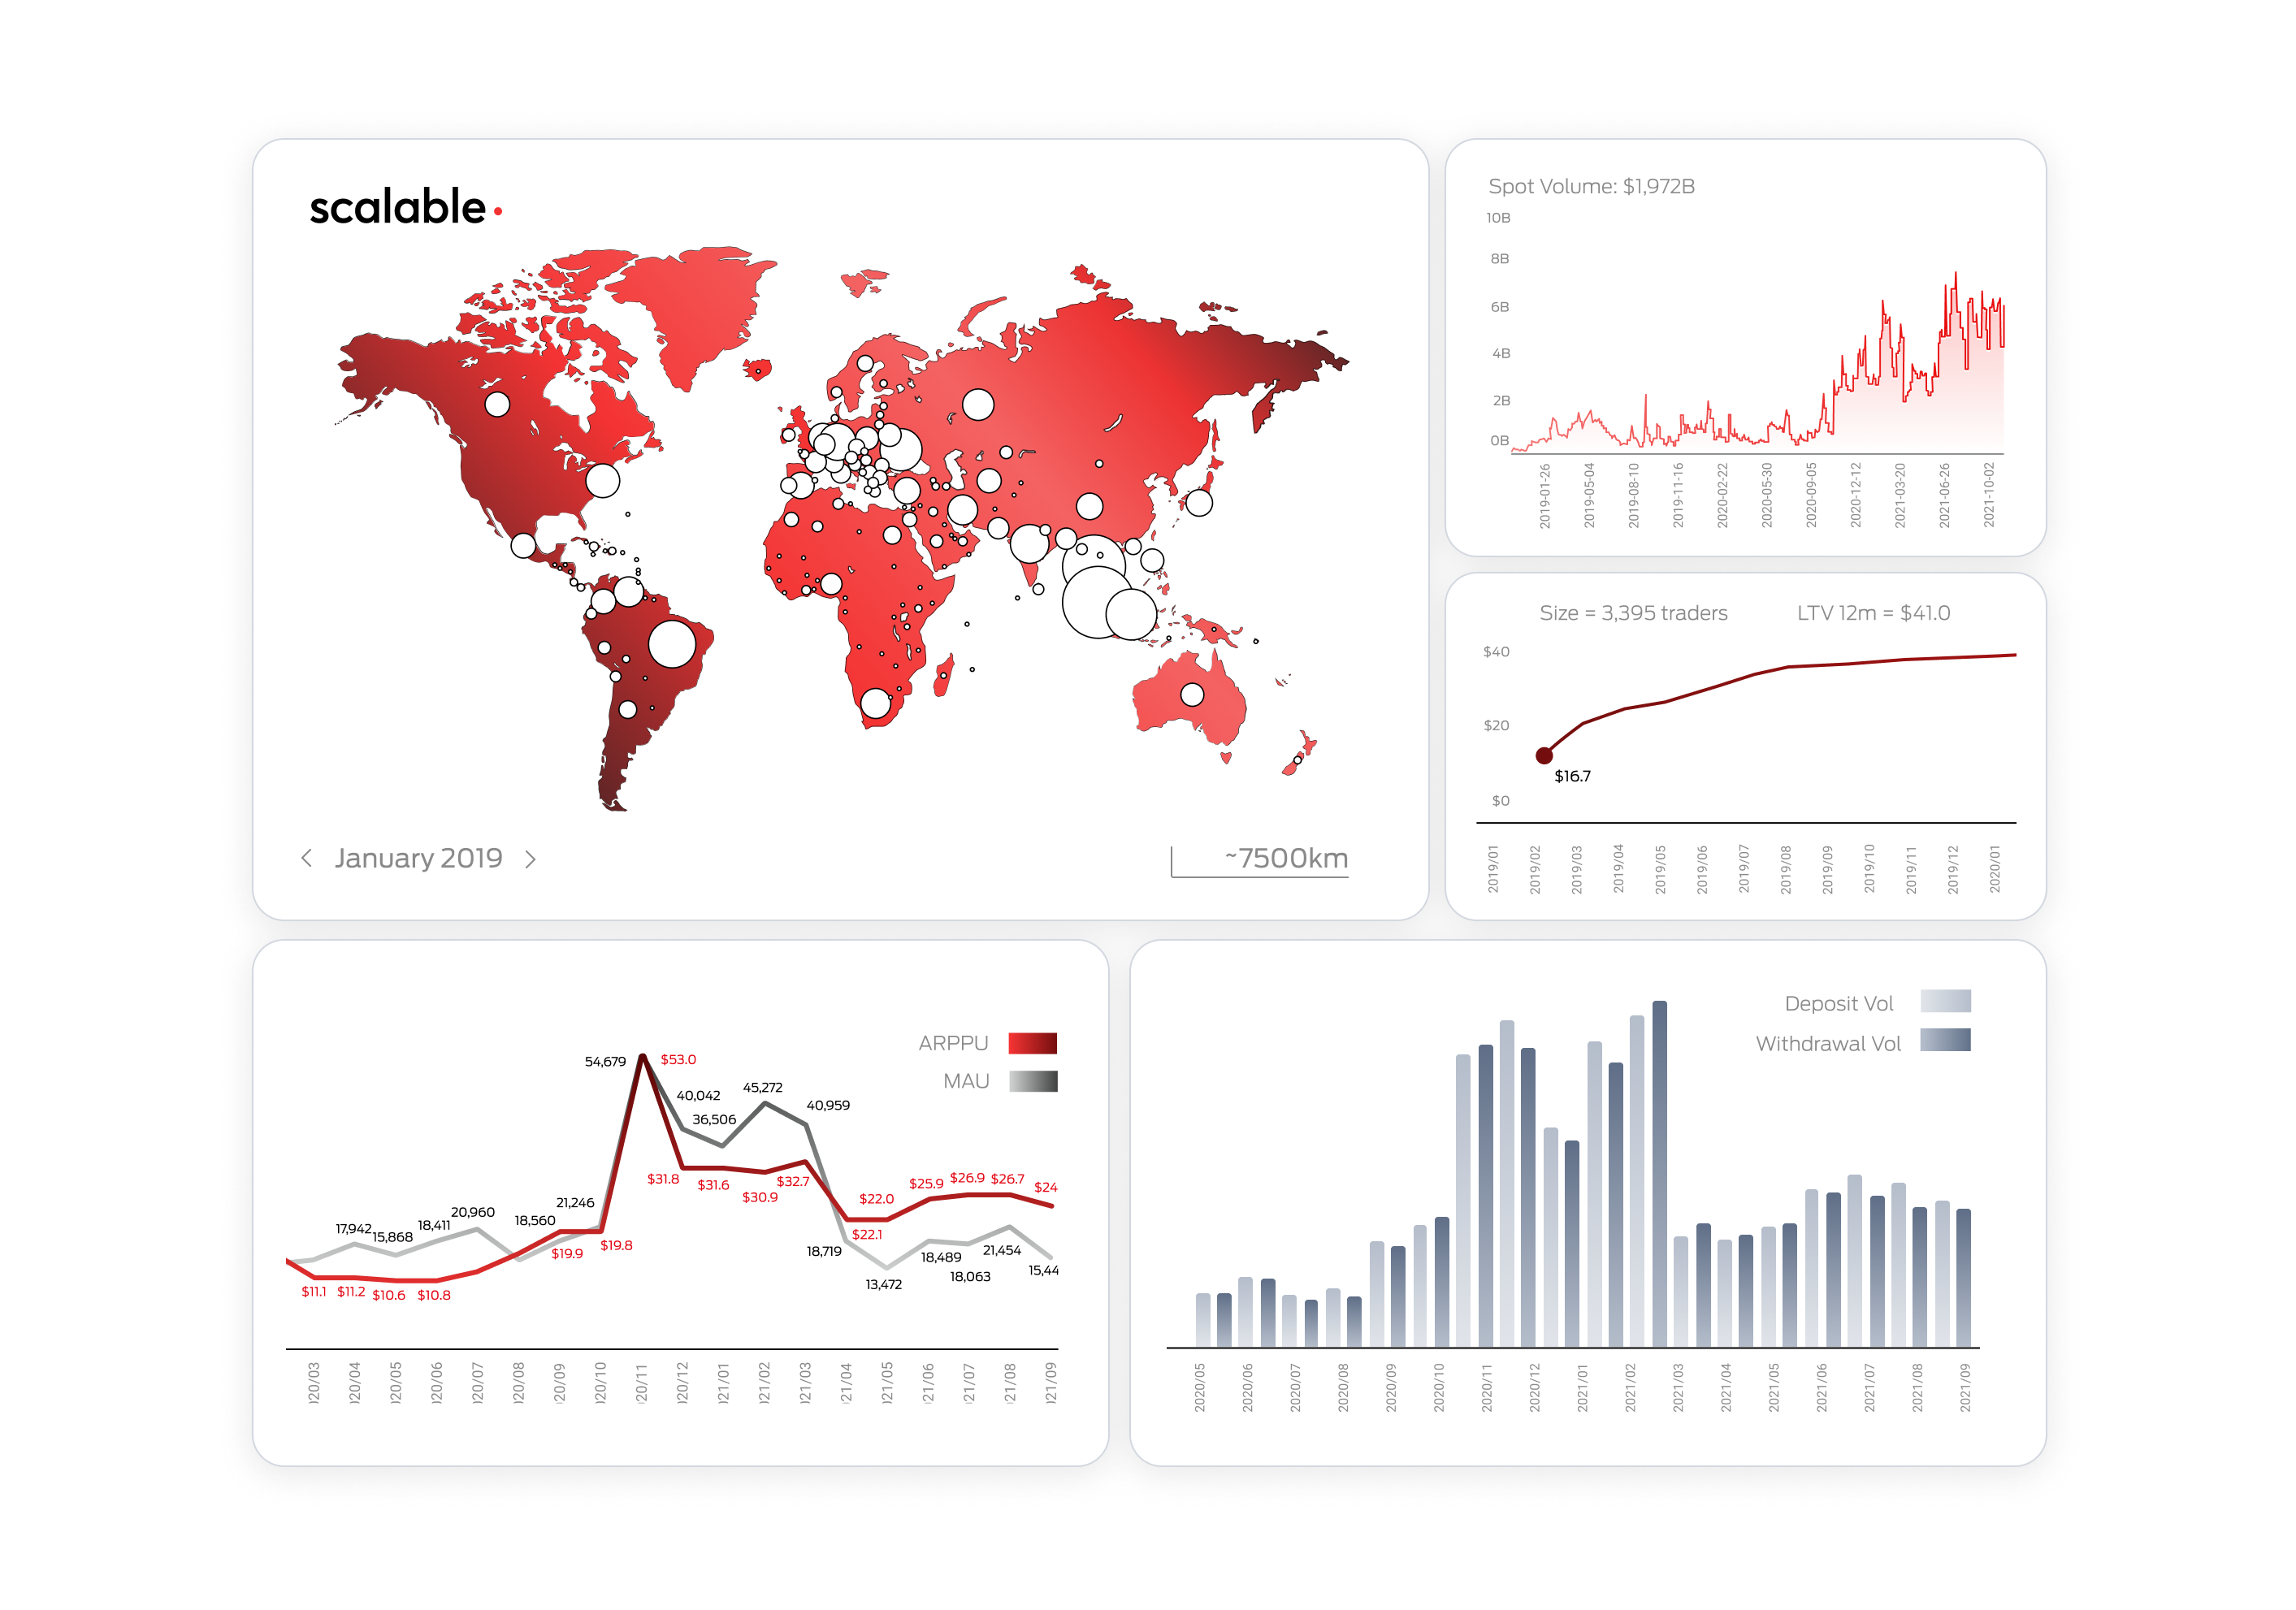
Scalable Solutions shares how its Broker BI analytics dashboards can bring new business-transforming insights to exchanges.
The Scalable Broker BI is a tailor-made analytical tool that offers crucial insights into the most in-demand metrics of an exchange business. The data-driven set of visual dashboards offer a user-friendly interface and quick, seamless access to real-time changes in the growth of an exchange’s trading volumes, revenues, and users.
Moreover, it provides an understanding into the efficiency of a brokerage’s promotional and marketing campaigns.
Among the key features that distinguish the analytics tools are:
- Dynamic, data-rich visual dashboards for an insightful dip into one’s business performance;
- Aggregated lifetime representation of changes in a variety of product metrics, including user activity, conversion indicators, trading volumes and fees, deposit and withdrawal statistics, and other KPIs;
- Quick access to user-friendly datasets with all supported metrics;
- Immediate day-to-day access to real-time data;
- Additional customizable analytics upon request
 Image for representation purposes only
The Broker BI tool gives exchange providers with important insights that can help steer the direction of their business through an understanding of how and where users trade, the most popular asset pairs, the lifetime value of an average trader and many more data points that can improve their operations.
Interested brokers can learn more about the Scalable Broker BI tool by scheduling a demo with the team.

